Distance Oscillator - evoThis shows the distance to a moving average of your choice as histogram, you can select your moving average at input "Oscillator Source".
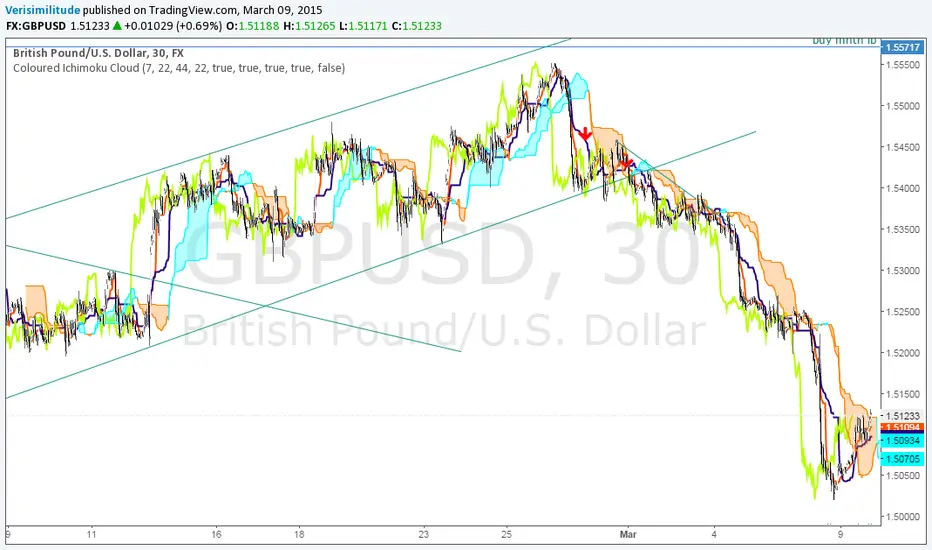
You need to have a plot on your chart (like EMA or anything else) so you can connect this indicator to it. I used Ichimoku Cloud's 20 period Conversion line (blue line) as example on the chart.
You can look for divergence on the histogram, that works because most moving averages follow price, they do not lead price. Which means if the distance gets smaller but the trend still continues, it may be a loss of momentum and often a sign for a reversal or pause.
I applied a moving average of the histogram, you can use this to wait for a cross to confirm divergence or can be useful to smooth signals a bit.
Of course you have to play around with it a little and see what works best for you, I have not tested all settings and timeframes.
ค้นหาในสคริปต์สำหรับ "Ichimoku Cloud"

Technical Analysis - Panel Info//A. Oscillators & B. Moving Averages base on TradingView's Technical Analysis by ThiagoSchmitz
//C.Pivot base on Ultimate Pivot Points Alerts by elbartt
//D. Summary & Panel info by anhnguyen14
Panel Info base on these indicators:
A. Oscillators
1. Rsi (14)
2. Stochastic (14,3,3)
3. CCI (20)
4. ADX (14)
5. AO
6. Momentum (10)
7. MACD (12,26)
8. Stoch RSI (3,3,14,14)
9. %R (14)
10. Bull bear
11. UO (7,14,28)
B. Moving Averages
1. SMA & EMA: 5-10-20-30-50-100-200
2. Ichimoku Cloud - Baseline (26)
3. Hull MA (9)
C. Pivot
1. Traditional
2. Fibonacci
3. Woodie
4. Camarilla
D. Summary
Sum_red=A_red+B_red+C_red
Sum_blue=A_blue+B_blue+C_blue
sell_point=(Sum_red/32)*100
buy_point=(Sum_blue/32)*100
sell =
Sum_red>Sum_blue
and sell_point>50
Strong_sell =
A_red>A_blue
and B_red>B_blue
and C_red>C_blue
and sell_point>50
and not crossunder(sell_point,75)
buy =
Sum_red>Sum_blue
and buy_point>50
Strong_buy =
A_red50
and not crossunder(buy_point,75)
neutral = not sell and not Strong_sell and not buy and not Strong_buy

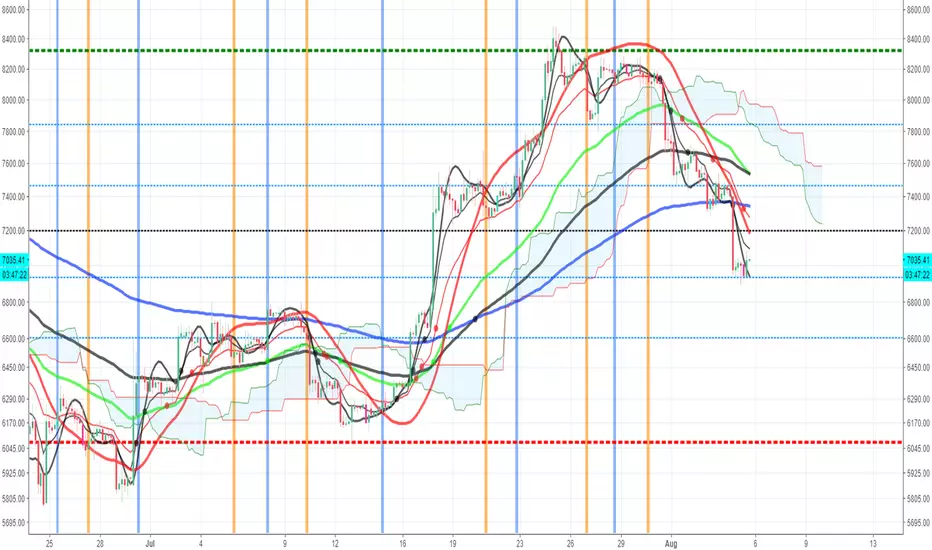
Lancelot Band - ATR Reversal+Trending IndicatorThis is an indicator I created recently, with the mind of spotting where price might reverse and where the price is trending. You can see this as the primary indicator for your system, however, it is recommended you use this in conjunction with other confirmation indicators.
This script focus solely on ATR or Average True Range.
This indicator is the combination of the baseline from the Ichimoku cloud and the concept of the Keltner channel.
Baseline period = 14
ATR period = 14
ATR Mult = 1.5
For reversal
Long when price crossover Lower band & Stop loss at xLower band
Sell when price crossunder Upper band & Stop loss at xUpper band
For Trend Following
Long when price crossover xUpper band and Stop loss at Upper band
Short when price crossunder xLower band and Stop loss at Upper band
Again, you will need other indicators to help you to succeed in this system. This indicator will not generate the best exit for your position but will generate a good entry signal when you use it with both volume indicator and exit indicator.
Works well on BTCUSD XBTUSD, as well as other major liquid Pair.
Feel free to follow me on Twitter @Lancelot_Auger for more free Alpha.
Please acknowledge my effort by like and follow.
And lastly,
Save Hong Kong, the revolution of our times.

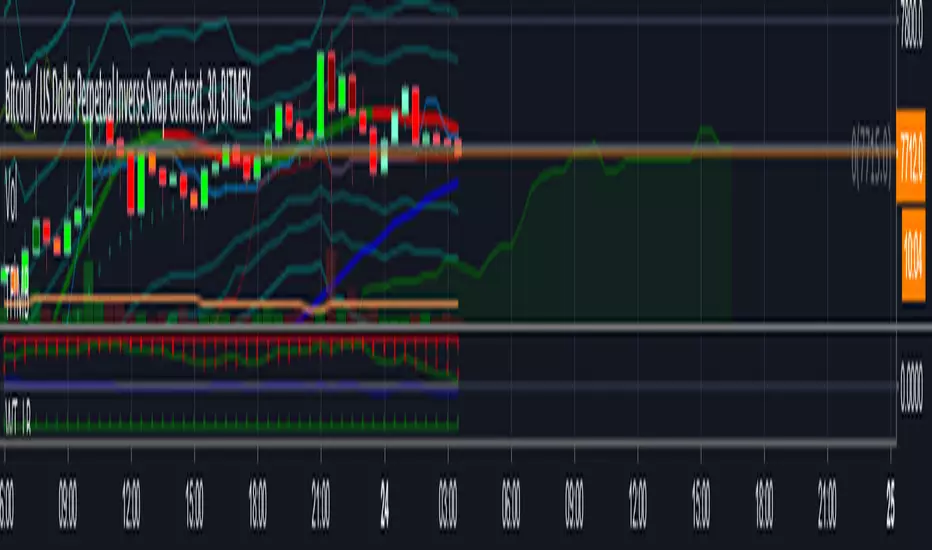
NOT-ONLY-SHORTThis script is the same as NOT-ONLY-LONG but without the security() function.
It use the following indicators: RMI + ADX + RSI + ICHIMOKU cloud only.
The fuchsia dot is the average price of the positions. The Take Profit is calculated from there.
It does not have Stop Loss, instead it makes a re-entry to try to improve the liquidation price.
Enjoy!

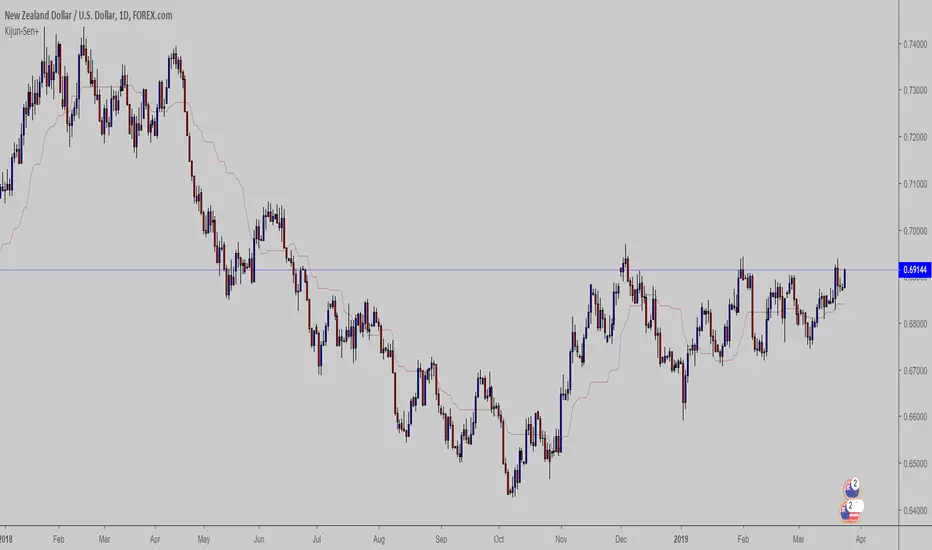
Kijun-Sen Strategy [DasanC]This strategy employs the Kijun-Sen line (from Ichimoku cloud) as a baseline for decisions.
In essence, the Kijun-Sen is a kind of moving average based on the High/Low range, similar to Donchian channels.
We wait for a crossover or crossunder to enter a new trade, then exit upon the next cross.
It works on 1H timeframe and above. It also works for all the Major FX pairs (at least from my tests).
I use the ATR and a multiplier to decide the S/L position as well as the volume of the trade.
I also use an equity protector to close out of all trades if a specific DD % level is reached. In theory, this should never happen with only one trade open at a time, however, if a user wants to modify the script to pyramid orders then the equity protector could potentially "save" an account.
The default settings should produce winning results on Major pairs. You can change the backtest time in the script by altering line #53:
>if(time > timestamp(2017,1,1,0,0) and time < timestamp(2019,1,1,0,0))
TODO:
Add 2 additional forms of confirmation
Add volume to filter losing trades
Add exit indicator

MTF Ichimoku CloudI published it because I could not find a good MTF glance.
なかなか良いMTF一目が見つからないので公開しました。

Kijun-sen Colored [aamonkey]I isolated the Kijun-sen from the Ichimoku Cloud and colored it.
You can do major damage by just entering when the price closes above the Kijun-sen and sell when it is the other way around.
Add some other confirmation indicators to filter some false breakouts and you are good to go.

(YEK) Combo(YEK) Combo is a combination of several indicators (listed below). You can use them together or one by one. Just click settings, and choose which of them to be shown.
Here are the indicators included in this script:
- Ichimoku Cloud
- Bollinger Bands
- Moving Average 1
- Moving Average 2 (In case of detecting golden crosses or death crosses)
- Exponential Moving Average
- T3 Tillson
- MavilimW
Enjoy!

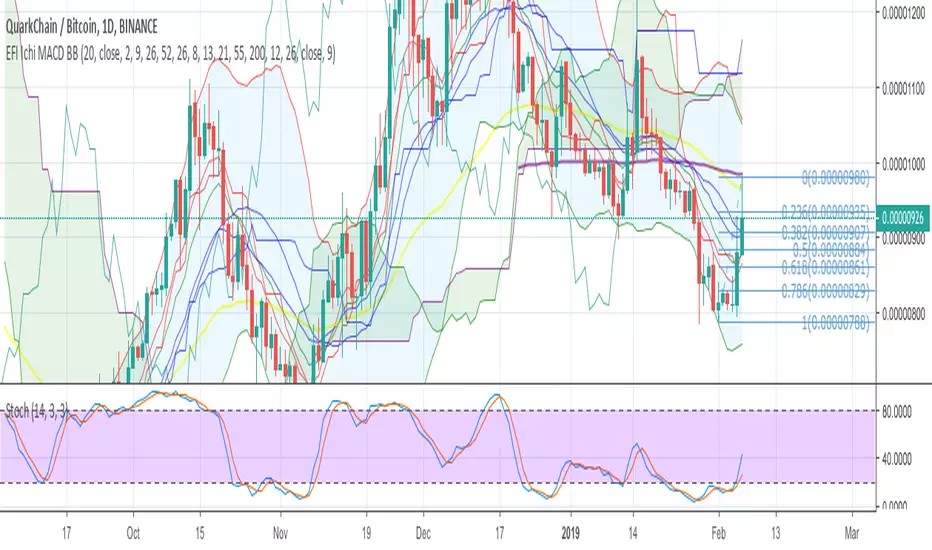
Fib EMA Ichi MACD BollingerAll in one necessary indicators for those, who limited to three of them.
Fibonacci EMA + EMA 200 (all can be modified for your custom periods)
MACD Graph overlay
Ichimoku cloud
Bollinger Bands
All is open, made from different basic indicators and tested to show correct data.
OptionsFanatic_Combo_4SMA_Cloud_BBThis special combo indicator provides following indicators in one..
1. 4 Simple moving averages 5,10,50,200
2. Ichimoku Cloud
3. Bollinger Band

All-In-One EMA Boll Cross SignalsThis one combines many commonly used indicators and signals into one.
1. EMA lines
2. SMA lines
3. Bolling Bands (EMA based)
4. Ichimoku cloud
5. 3/8, 10/20 EMA crosses
6. 5/10 SMA crosses
7. MACD crosses

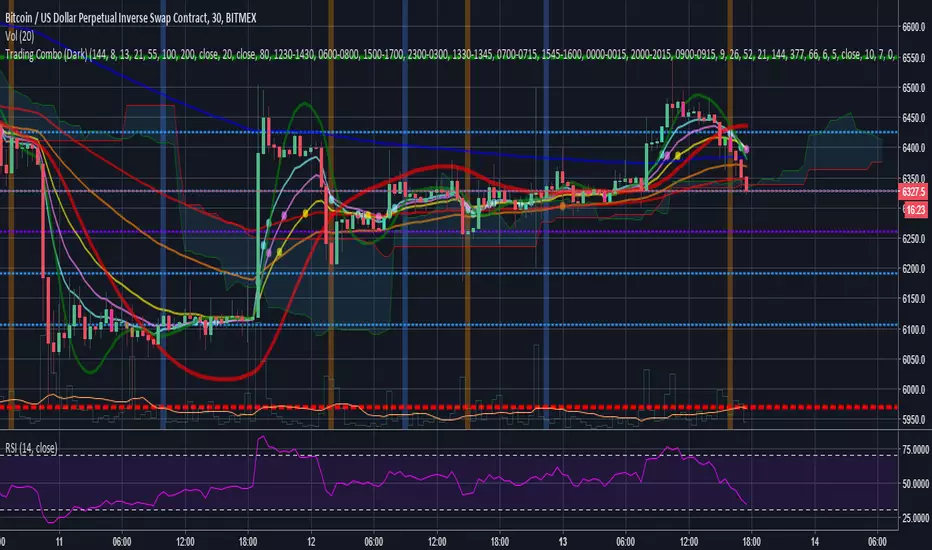
Trading Combo (Dark)This is a combo of many indicators including :
Ichimoku Cloud (With Buy and Sell Signals)
EMA
MA
HULL MA
Fibonacci Lines
Bitcoin 0.57% Kill Zones(Turned off by Default)
MA Turning Points
Reversal(Pin) Bars and Upshaved and Downshaved Bars(Inside and Outside Bars Disabled By default)
Credits to revanchdg for creating the script!
Credits for the source code go to:
Lazybear
ChrisMoody
100kiwi
Gesundheit
Updates:
- Removed all black colors so the script also works fine on the Dark theme
- Changed EMA9 to EMA8 and added EMA13
- Updated some labels for ease of configuration
Trading ComboThis is a combo of many indicators including :
Ichimoku Cloud(With Buy and Sell Signals)
EMA
MA
HULL MA
Fibonacci Lines
Bitcoin Kill Zones(Turned off by Default)
MA Turning Points
Reversal(Pin) Bars and Upshaved and Downshaved Bars(Inside and Outside Bars Disabled By default)
Credits to for the source code:
Lazybear
ChrisMoody
100kiwi
Gesundheit
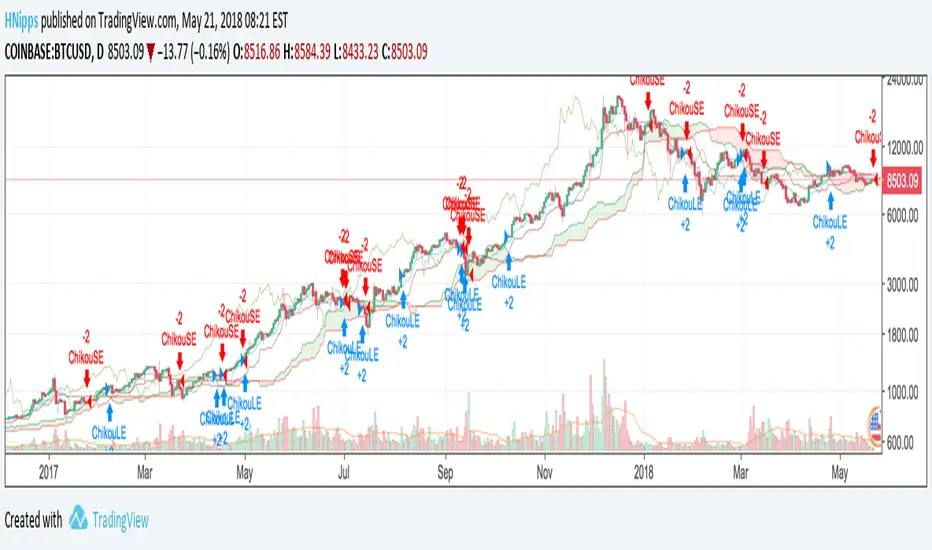
Chikou CrossoverA very simple Ichimoku Cloud strategy. Buy when Chikou Span crosses above price. Sell when Chikou Span crosses below price.

[RS]MTF Ichimoku Cloud V0Request for T_C
The displacement cant be converted (a approximation is possible by calculating the n_bars the time frame occupies by the displacement).